The Carbon Codex
The 3 C’s of the Carbon Cycle
GHG gas emissions, particularly carbon dioxide (CO2) emissions from combustion of fossil fuels (ff-CO2), are a part of our daily lives and have been since about 1880 when the first gasoline powered car was invented and sold to the public. We frequently fill our cars with gasoline dispensed with a precision of one-thousandth of a gallon (0.001 gallons) and with a price of 0.90 cents, yet we cannot buy or assign such precision to any product that returns our automobile CO2 emissions to the Earth. We may ask, more generally, how much CO2 is sequestered or taken up by the land and the oceans or how much can be sequestered and reduced by management practices and technology to offset our gasoline purchase? The same query applies to carbon sequestered by forests–how much carbon is stored in forests? What types of measurements are needed to quantify and value forest carbon sequestration and keep track of forest carbon dynamics? It is clear that while consumers know the exact quantity of fossil fuel that we use and transform into CO2 we have no way to quantify and “buy” back that CO2 to manage our emissions. The public has limited options to actively participate in quantified emission reduction efforts.
One of PαC’s goals is to provide consumers with readily available and verified GHG products to directly manage emissions. Read our White Paper: Verified Carbon Products for the Public: The Missing Link between the Atmosphere and the Biosphere, by clicking here PEM_HCBE_White Paper_Public_01-30-2015.
Planet Alpha Corp. (“PαC”) employs measurement, verification and accounting for the “full” carbon cycle–the 3C’s comprised of 12CO2, 13CO2 and 14CO2, reported as metric tons of carbon ( 1 tC = 1,000 kg) or metric tons CO2 equivalent CO2(e). Direct measurement of CO2 and GHG’s is addressed by PαC’s Direct Forest Carbon Measurement Protocol (DMFCP). The public is generally familiar with “CO2” and likely the amount in the atmosphere, expressed as parts per million (e.g., ppm). Millions of measurements of the most abundant form of CO2, 12CO2, are made each year. Yet the high data rate for 12CO2 is not enough to carefully track, or partition, the movement or flux of ff-CO2 from the atmosphere to plants and soils and to the ocean across geographic scales. The addition of the less well-known or rare forms of CO2, represented by 13CO2 and 14CO2, provide sensitive tracers for biological carbon cycling and for the fate of ff-CO2.
Measurements for 13CO2 and 14CO2 are lacking relative to 12CO2 despite their importance due to the difficulty of measuring these forms of carbon in the field at high precision and at high data rates. PαC is devoted to developing or acquiring emerging and commercial technologies that allow such measurements. When the PαC DMFCP approach is employed across a project site, or multiple sites, the carbon cycling and budget of the site can be partitioned and quantified. The Carbon Codex represents a summary of the major features of the 3C’s of the carbon cycle that can be easily understood. Underlying technical details are provided as references below.
Referring to the Carbon Codex graphic, the left column of the table shows data for the three species of carbon for which we can apply direct measurement, verification and accounting approaches–carbon 12 (12C), carbon 13 (13C) and carbon 14 (14C). The combination of measurements for the 3C’s represent the foundation for new PαC carbon financial products. The middle column provides contemporary science data for the global presence of the 3C’s and their planetary cycling. The right column provides information on the relative number of measurements made for each of the 3C’s. Note that measurement for the rare forms of carbon (e.g., 13C and 14C) are vastly restricted in total measurements relative to 12C yet the rare forms of carbon can be directly linked to the quantification of carbon cycling, fossil fuel carbon emissions and carbon management. PαC is integrating new instrumentation capable of measuring the rare forms of carbon in real time and in the free atmosphere with proprietary and patented hardware and software to yield new and credible GHG financial instruments.
The 3C’s are described further below.
Carbon 12 (12CO2)
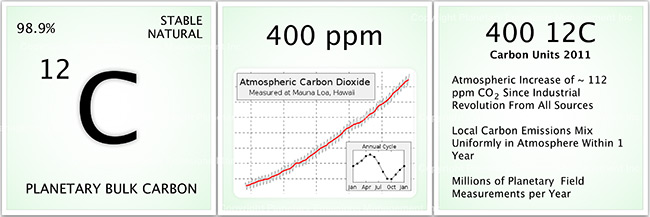
Understanding carbon accounting is somewhat like understanding your bank statement. What if your bank statement only reported your monthly balance with no transaction details of deposits or credits? How could you manage your finances and plan for deposits and withdrawals to balance each other? You could guess or estimate the type and amount of transactions that occurred but the risk of invalidation and error for this approach would likely be high. The same is true for our ability to understand and manage carbon budgets at local to global scales. Estimation of GHG emission reduction is likely to be error prone. There is no substitute for direct measurement of GHG dynamics. In the case of CO2 we must also consider the value of measuring different species of CO2. For example, millions of measurements of “bulk CO2” or 12CO2” (see graphic above) are made each year across thousands of locations yet the corpus of CO2 measurements is not typically sufficient to discern or identify detailed carbon budgets or “deposits and withdrawals” for specific areas such as forests, industries, agriculture, and the global carbon cycle itself. In particular, the types and magnitude of “transactions” for carbon sequestration are difficult to track and pinpoint with bulk CO2 alone. The panel above shows that 12CO2 comprises the bulk of planetary carbon, or about 99%, deposited at the time of Earth’s formation. Because the Earth is a closed system the total amount of planetary carbon does not change but is cycled through the biosphere. The concentration of CO2 in the atmosphere has been well documented over the last 60 years revealing the increase in atmospheric CO2 as shown in the middle panel from ~315 parts per million (ppm) in 1960 to 400 part per million (ppm) in 2013 and exceeding 400 ppm in 2016.
For simplicity, one can also think of the CO2 increase in terms of “units” with a unit equal to 1 ppm. The insert shows that the amount of CO2 in the atmosphere also changes according to season in the mid to high latitudes at local scales. Atmospheric CO2 is taken up during the summer months by plants during growth–you can think of it as the planet “breathing in” CO2. During the winter, however, when plants are not growing CO2 is emitted to the atmosphere due to plant and soil respiration and decay of organic material. This seasonal phase is like the planet “breathing out” CO2. In the case of forests, the difference in carbon between summer and winter months determines the net forest carbon or carbon sequestration over a full year. PαC measurement applications allow for the determination of net carbon sequestration using all forms of carbon including 12CO2. Detailed graphs for atmospheric CO2 can be found on the NOAA Earth Systems Research Laboratory website: http://www.esrl.noaa.gov/gmd/ccgg/trends/. The last panel summarizes the CO2 concentration increase as ~112 units (e.g., ppm) since the industrial revolution (e.g., ~400 ppm – ~288 ppm) Millions of measurements are made for bulk 12CO2 each year. The objective of CO2 emissions reductions policy strategies and technologies is to slow the increase or rate of atmospheric CO2.
Carbon 13 (13CO2)
In addition to bulk CO2 two other species are important in understanding the carbon cycle. Isotopic species of CO2 or “carbon isotopes” are direct tracers for different carbon transactions or components of the carbon cycle. Carbon 13 is present at a mere ~1% of all atmospheric carbon yet is a powerful diagnostic for biological Earth processes on local to global scales. Although 13CO2 is present in small amounts its importance in tracking carbon biology of forests and soils is very high and well understood by the scientific community. Despite its importance, the number of real-time measurements for 13CO2 across diverse field projects are very small compared with bulk 12CO2. However, the technology to greatly expand 13CO2 field measurements is available and is a key part of PEMs measurement program. 13CO2 will provide data for forest and soil carbon budgets including how these systems are affected by changes in climate (e.g., rainfall and temperature) across relevant scales. 13CO2 measured above a forest can be compared to the carbon 13 “units” measured high in the well mixed atmosphere. The comparison will reveal local to regional trends in forest carbon sequestration biology.
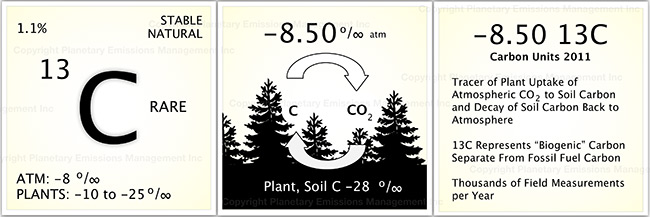
The first 13C panel shows that it is a stable and natural form of carbon, much like 12CO2, but 13CO2 is an isotope of carbon having an extra neutron in its nucleus. Both 12CO2 and 13CO2 are cycled through the biosphere as gaseous form in the atmosphere to the material components of the Earth such as plant material,soil organic carbon and carbonates. The amount of atmospheric 13CO2 has been measured relative to 12CO2 and was ~ -8.5 per mil, or parts per thousand, in 2015, or to keep it simple, ~ -8.5 units of 13CO2 (see Mauna Loa, Hawaii for updated measurements). Plants also take up 13CO2, but with slight differences, causing plants to have less 13C in their tissues than the atmosphere. Plants in nature, without fail, have a range of 13CO2 units from about -10 to -28 units. The middle panel shows that 13C units cycle between the atmosphere and the forests providing a way to monitor plant growth and related factors on local scales. Atmospheric 13CO2 is also influenced by the burning of fossil fuels and must be accounted for when using 13C to monitor plant growth and carbon balance. The third panel summarizes biospheric features of 13CO2 and a small data relative to 12CO2.
Carbon 14 (14CO2)
Increasing emissions of CO2 from human activities, specifically from ff-CO2, are the main concern of humanity–it is the main perturbation to the pre-industrial carbon cycle fueled by the need for energy and subsequent exploitation of fossil fuels to build cities, transportation and the infrastructure of humanity. The convergence of energy production (e.g., ff-CO2) driven in part by population increases and subsequent climate change due to atmospheric CO2 increases are emblematic of modern humanity. While estimates of emissions from fossil fuels based on combustion theory are reasonable the return or sequestration of CO2 relative to ff-CO2 emissions by both natural and anthropogenic activities are surprisingly uncertain. It’s the bank statement problem. However, by measuring 14CO2 in the atmosphere for specific locations we can readily track the dynamic “transactions” for ff-CO2 both as emitted and sequestered carbon. Currently, the number of 14CO2 measurements is minute relative to bulk 12CO2 and 13CO2 despite its importance to all things ff-CO2. PEM is working to break through this barrier using unique new analyzers and can provide measurements in real-time or near real-time increments to allow unprecedented coverage across space and time. 14CO2 measurements in forests will allow, for the first time, quantification of the role of forests in ff-CO2 sequestration and a full carbon accounting of the forest/soil carbon dynamics. Estimates for carbon sequestration based on theoretical models simply are not realistic. Measurements of the “3C’s” of the Carbon Cycle are used by PEM as a basis for unique measurement-linked carbon securities that provide revenue for forest conservation, economic management for human endeavors and a metric for the future of forest carbon sequestration.
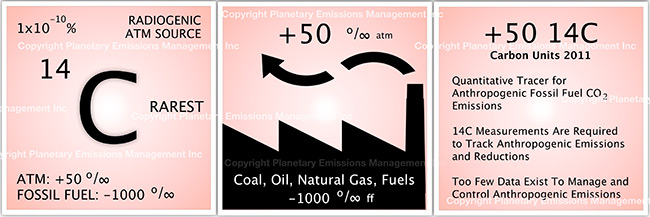
The first panel indicates that 14C is radiogenic, meaning it decays with time, and is present at ~10<sup>-10</sup> % or one part per trillion. 14C, unlike 12CO2 and 13CO2, is produced in real-time in the upper atmosphere by interaction of cosmic rays with molecular N<sub>2</sub>. The production of 14CO2 in the atmosphere results in enrichment with known values of ~ +50 per mil, or 14C units. 14CO2 is radiogenic decaying by one-half of its initial concentration within ~57,000 years. Since plants that become coal, oil and natural gas have been buried for millions of years all of the 14CO2 they took up is completely gone. Thus, when fossil fuels are burned the CO2 they release is devoid of 14CO2 with a value of -1000 14C units. The large range of 14CO2 values from +50 in the modern atmosphere to -1000 for fossil fuel CO2 provides an excellent way to track fossil emissions and their fate in the biosphere as shown in the middle panel. The last panel summarizes the current value for 14CO2 as +50 units, that the measurement of 14CO2 in the atmosphere is a requirement to track fossil fuel emissions and that far too few measurements of 14CO2 are made to control and manage fossil fuel emissions. PEMs technology, the Global Monitor Platform, is designed to offer the capability for a high data rate for 14CO2.
____________________________________
References:
Periodic Table (www.chemnetbase.com)
Chart of the Nuclides (www.nndc.bnl.gov/chart/)
CO2 concentration and 13C values (www.esrl.noaa.gov)
Plant 13C Fractionation
All other sotopic values (Reddy et al., 2008; Widory 2006; O’Leary 1988; Svetlik 2009; Levin 2003)
Isotopic ratio definitions:
delta (δ) value in per mil: δ13C = [(13C/12C) sample/(13C/12C) std – 1] x 1000 (per mil, std is PDB)
Delta (Δ) value in per mil: Δ14C = [(14C/12C) sample/(14C/12C) std – 1] x 1000 (per mil, std is NBS Oxalic Acid 1)


 Biodiversity (B) Avoided Carbon
 Gorilla Habitat (G) Avoided Carbon
 Methane (CH4)
 Indigenous Peoples (IP) Avoided Carbon
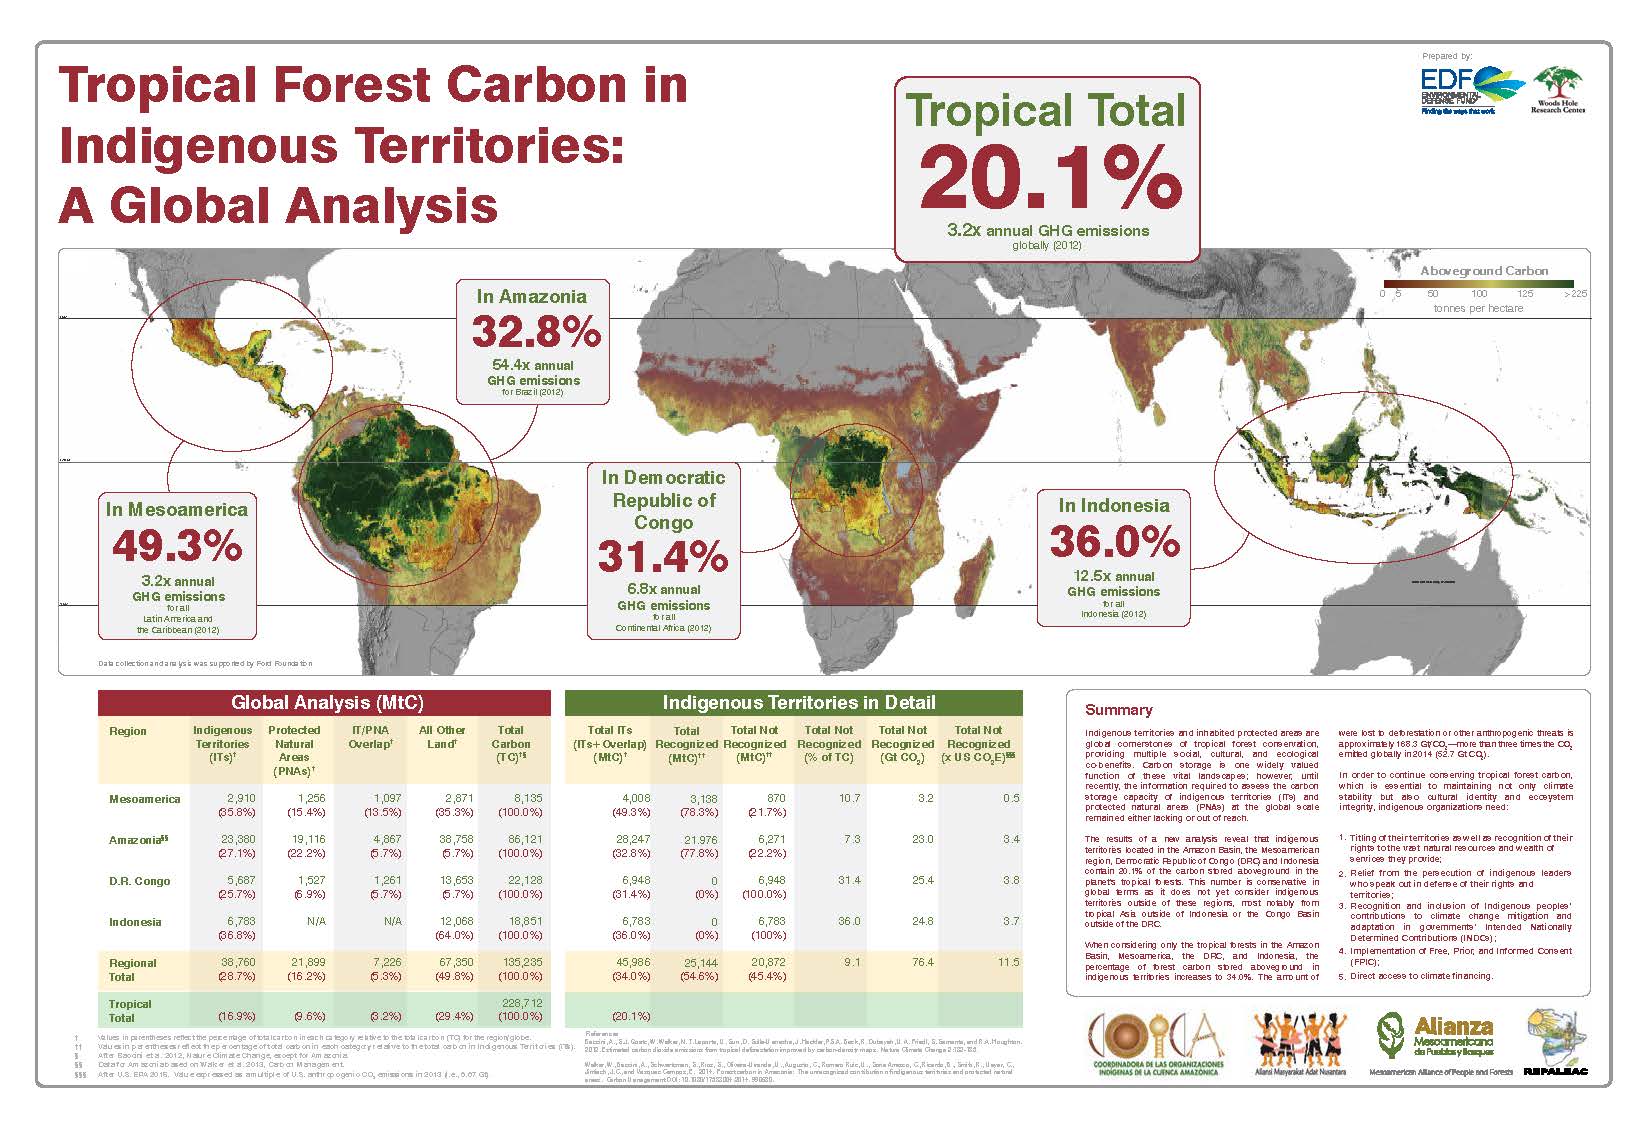
 Improved Forestry Management (IFM) Sequestration
 Afforestation (AF) Sequestration
 Agroforestry (GF) Sequestration
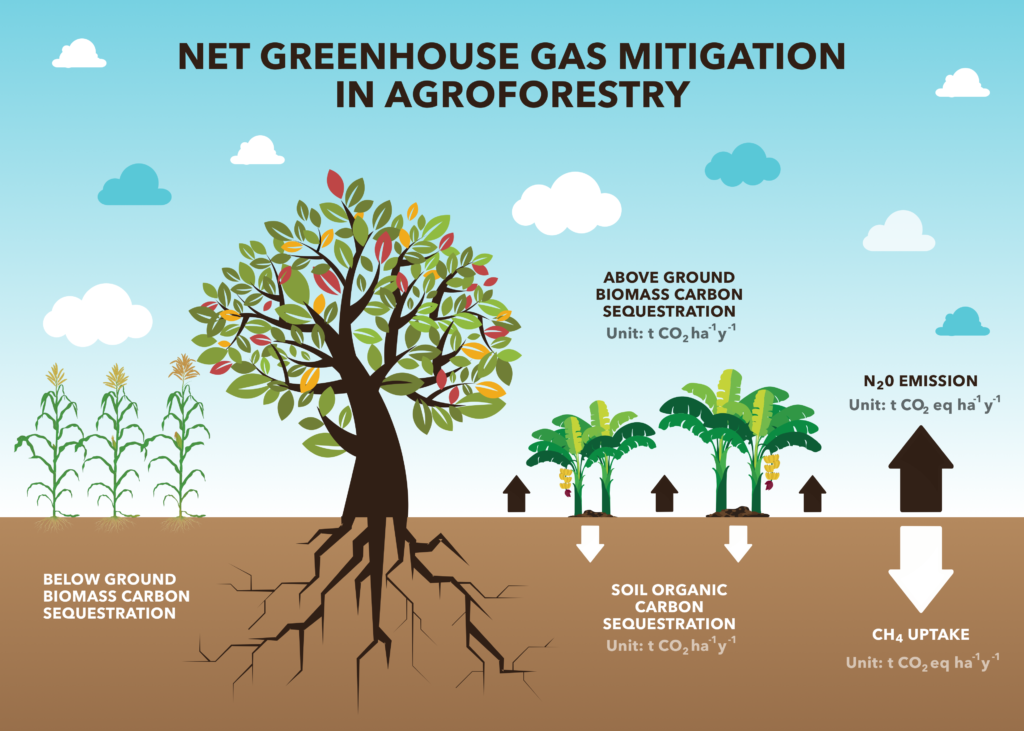

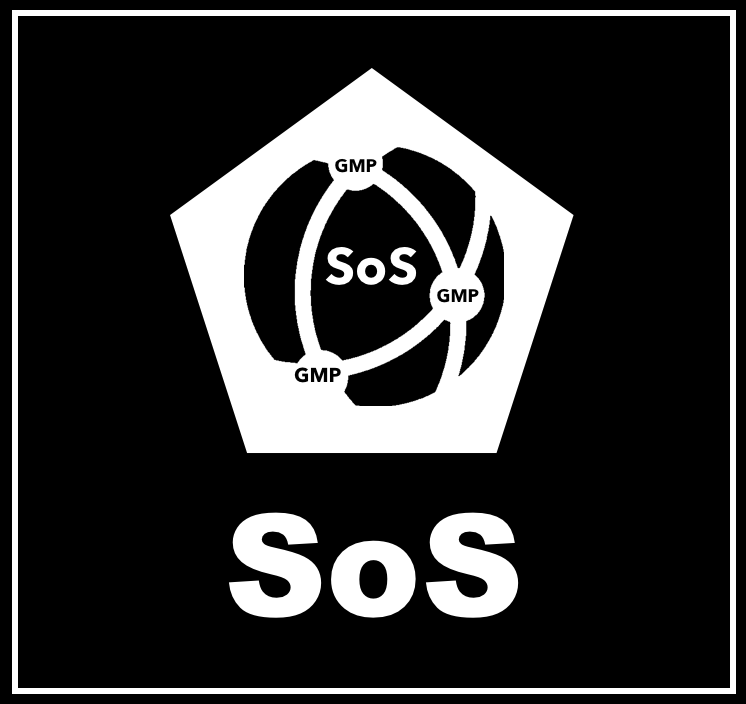 The System of Systems (SoS)
 QuantumQarbon
 Carbon isotopic analysis (IA)

 Carbon Dioxide (CO2)
 Working Forest Carbon Sequestration
 Eddy Covariance (EC)
 Soil Accumulation Chambers (SAC)
 Soil gas probes (SGP)
 Exsolvation of Dissolved CO2 (CO2(aqueous)) and CH4
 Vehicle Mounted Fast Response Gas Analyzers (VM)
 Unmanned Aerial Systems (UAS) and Remote Sensing (RS)
 A variety of UAS’s may be used in a project to record the status of forest conditions at low altitude (e.g., ~1,000 ft) on a routine basis, when a disturbance has occurred (e.g., hurricane, drought, timber operations) or for surveillance of forest activity by landowners or others accessing the site. Typical capabilities may include spectral imaging of the tree canopy and mapping functions to reveal differences along the flight path over time. In addition, UAS’s may also carry miniaturized gas sensors for CO2, CH4 and other atmospheric gases. The use of remote sensing (RS) for ecological research is well documented covering spectral bands for normalized difference vegetation index (NDVI), leaf evapotranspiration and other features of the biotic and abiotic project area.
 Flask Collection (FC)
 Nitrous Oxide (N2O)
 Sulfur Hexaflouride (SF6)
 Tree Plantation
 Perfluorocarbon (PFC)
 Water Vapor (H2O)