Ricardo Esparza Joins Planet Alpha Corp. as Mexico In-Country Representative. He holds an M.S. in Environmental Engineering on the Sustainable Water Treatment and Climate Change Impacts track from Columbia University.
Ricardo Esparza Joins Planet Alpha Corp. as Mexico In-Country Representative. He holds an M.S. in Environmental Engineering on the Sustainable Water Treatment and Climate Change Impacts track from Columbia University.


 QuantumQarbon
Direct measurement of the rare forms for carbon dioxide track the source and magnitude of additions and subtractions of CO2 to the atmosphere. QuantumQarbon® emphasizes the nature and importance of high frequency synchronous field measurement for both 13CO2 and 14CO2 while also measuring “bulk” carbon dioxide as 12CO2. The carbon 13 and 14 forms of CO2 although consisting of very small, discrete amounts compared to 12CO2, are observable at the one-part-in-one-thousand and one-part-in-one-trillion levels, respectively. Despite the small amounts in the atmosphere for both rare forms of CO2 they can be measured with high precision. The GMP was designed to increase the data rate for both isotopic forms, particularly for 14CO2, as no high precision 14CO2 analyzer is available commercially. QuantumQarbon® tracks forest carbon cycling and loss of carbon from soils buried in forest ecosystems. The measurement of QuantumQarbon® across the geographic boundary of a project also provides the foundation for new and innovative forest carbon sequestration offset products. In addition, 14CO2 is the only direct conservative tracer of the interaction of fossil fuel CO2 with our planetary forest ecosystems.\
Additional Reading
Marino, Bruno DV, Michelle Bright, and Glen Gronniger. “Design and package of a 14CO2 field analyzer: the Global Monitor Platform (GMP).” In SPIE Optical Engineering+ Applications, pp. 81560E-81560E. International Society for Optics and Photonics, 2011.
The two panels below describe 13CO2 and 14CO2 background information. Please click here for a detailed description of the QuantumQarbon species.
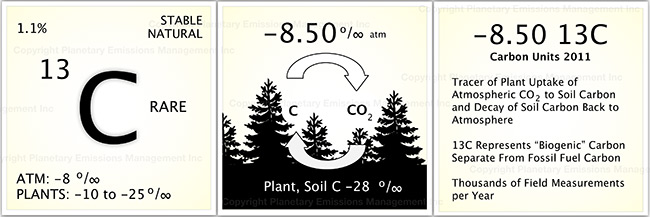
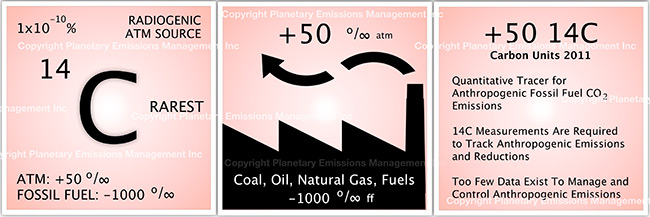
 Carbon isotopic analysis (IA)
Analysis of plant and soil samples for carbon isotope ratios (e.g., 13/12C, 14/12C) can reveal patterns of carbon cycling related to water use efficiency of plants and dynamics of soil carbon cycling. PαC projects will routinely collect plant,water and soil samples from selected sites of the project.
Additional Reading:
Gurmesa, Geshere Abdisa, Xiankai Lu, Per Gundersen, Yunting Fang, Qinggong Mao, Hao Chen, and Jiangming Mo. “Nitrogen input 15 N signatures are reflected in plant 15 N natural abundances in subtropical forests in China.” Biogeosciences 14, no. 9 (2017): 2359.
Roberts, Patrick, Scott A. Blumenthal, Wolfgang Dittus, Oshan Wedage, and Julia A. Lee‐Thorp. “Stable carbon, oxygen, and nitrogen, isotope analysis of plants from a South Asian tropical forest: Implications for primatology.” American Journal of Primatology 79, no. 6 (2017).
Wang, Yafeng, Liding Chen, Yang Gao, Shibo Chen, Weiliang Chen, Zhuo Hao, Junjie Jia, and Ning Han. “Geochemical isotopic composition in the Loess Plateau and corresponding source analyses: A case study of China’s Yangjuangou catchment.” Science of the Total Environment 581 (2017): 794-800.
Coleman, David C., ed. Carbon isotope techniques. Academic Press, 2012.


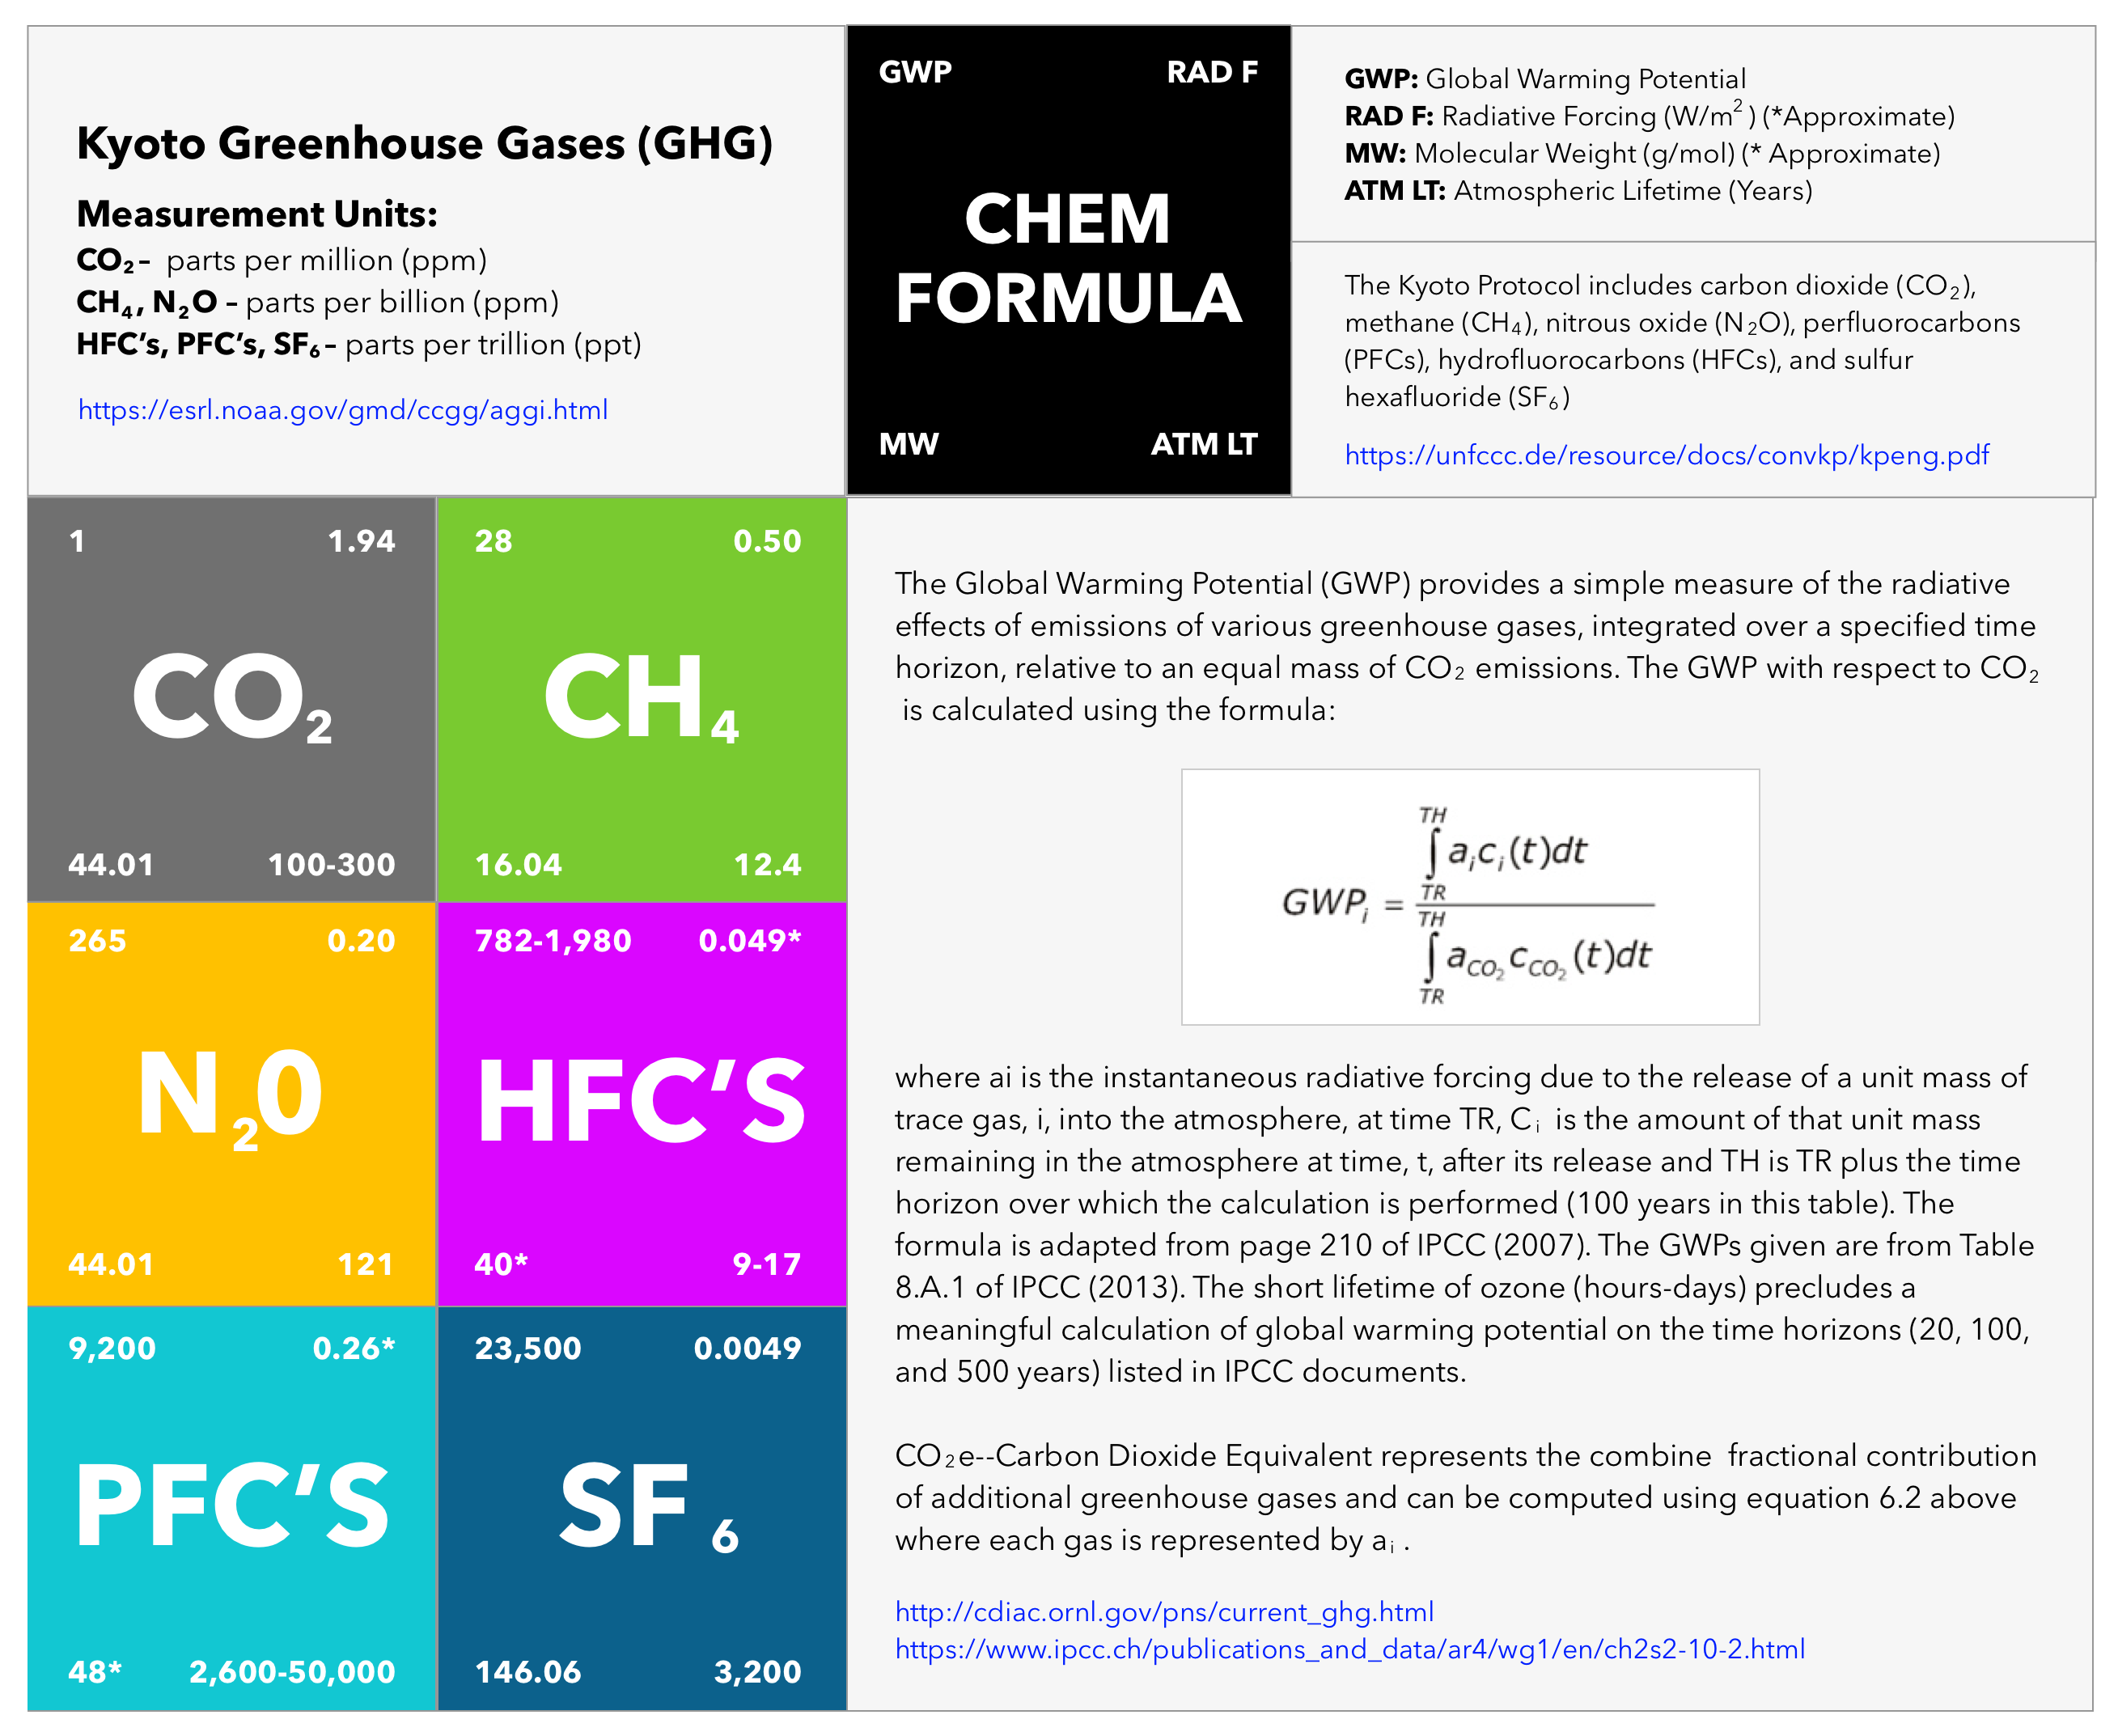
HFCs and PFCs are used primarily for energy-consuming applications such as refrigeration, air conditioning and heat pumps, and building and appliance insulation. Unlike anthropogenic greenhouse gases emitted as an immediate consequence of the burning of fossil fuels to generate energy, most HFCs and PFCs are contained within equipment or products for periods ranging from a few months (e.g., in aerosol propellants) to years (e.g., in refrigeration equipment) to decades (e.g., in insulating foams). Thus, emissions significantly lag consumption and, because HFC systems are relatively new, emissions will continue to grow as new sources are produced. Both the quantities used and patterns of use of HFCs, and PFCs are changing as they are phased out under the Montreal Protocol of 1999.
Additional Reading:
Working Group III: Mitigation
http://www.ipcc.ch/ipccreports/tar/wg3/index.php?idp=144
Working Group I: The Scientific Basis
https://www.ipcc.ch/ipccreports/tar/wg1/137.htm
Heath, Eric A. “Amendment to the Montreal Protocol on Substances that Deplete the Ozone Layer (Kigali Amendment).” International Legal Materials 56, no. 1 (2017): 193-205.
Purohit, Pallav, and Lena Höglund-Isaksson. “Global emissions of fluorinated greenhouse gases 2005–2050 with abatement potentials and costs.” Atmospheric Chemistry and Physics 17, no. 4 (2017): 2795-2816.
 Working Forest Carbon Sequestration
A Working Forest (WF) is harvested for timber production on a periodic basis while forests are regenerated in other areas previously harvested. Working forests are defined as forests that are actively managed to generate revenue from multiple sources, including sustainably produced timber and other ecosystem services. Working forests are not converted to other land uses such as residential development. Humanity utilizes wood products for cooking and heating fuel construction of homes, paper and countless other uses. As population grows over the coming decades the demand for forest products will increase. How can we balance the need for forest products with the goals of forest conservation and carbon sequestration? The project area of a WF is likely to have portions of forest that are simultaneously being harvested, rapidly regrowing and reaching maturity. In many countries the convergence of humanitarian needs for forest products and the needs of fauna for subsistence result in a loss of both. How can we manage the increasing pressure on forests?
PαC will employ the same methods for direct measurement of net forest carbon sequestration across a WF project area as used for other forest carbon sequestration projects (e.g., conservation). In the case of WF’s the export of wood as timber and conversion of timber to long-lived wood products including carbon storage in buildings can also be considered in the net carbon sequestered over selected time periods. PαC direct project measurements will provide data to make informed decisions about how to cultivate forests for climate-change mitigation and for material supply of humanitarian usage. The direct measurement of forest response to climate change will help answer the question of whether it is better to harvest or conserve trees, and how much, across a project area. The PαC WF management strategy is to increase both forest stocks and timber harvest through a variety of measures such as planting community forests for humanitarian needs, managing forest species for improved growth, carefully selecting trees for harvest, substitution of wood for steel and cement, and actively replanting forest areas that have been damaged by extreme weather events, disease or fire. WF projects can actively contribute to climate change mitigation and to humanitarian needs based on direct measurement as employed by PαC.
Additional Reading
Roise, J. P., K. Harnish, M. Mohan, H. Scolforo, J. Chung, B. Kanieski, G. P. Catts, J. B. McCarter, J. Posse, and T. Shen. “Valuation and production possibilities on a working forest using multi-objective programming, Woodstock, timber NPV, and carbon storage and sequestration.” Scandinavian Journal of Forest Research 31, no. 7 (2016): 674-680.
Colgan, Charles, Malcolm L. Hunter, Brian McGill, and Aaron Weiskittel. “Managing the middle ground: forests in the transition zone between cities and remote areas.” Landscape ecology 29, no. 7 (2014): 1133.
Smith, Joyotee, and Sara J. Scherr. Forest carbon and local livelihoods: assessment of opportunities and policy recommendations. No. CIFOR Occasional Paper no. 37. 2002.
Working Forest Criterion. Yale University, School of Forestry and Environmental Studies.
 Eddy Covariance (EC)
The EC method measures gas fluxes in and out of an ecosystem. The EC method is the most accurate and direct approach available for determining the dynamic net ecosystem exchange and sequestered carbon for a forest project area. The method is based on direct and fast measurements (e.g., 10 Hz) of actual gas transport characterized by a three dimensional wind field in real time. The concentration of the gas of interest (e.g., CO2, 13CO2 and 14CO2) is measured concomitantly resulting in flux of the gas. In the case of QuantumQarbon, the isotopic forms of CO2, flux for each isotope is determined (e.g., 13CO2, 14CO2) and employed to create unique DMFCP carbon products. The EC method has been applied worldwide under remote and harsh conditions employing solar power for months without maintenance. The EC method is deployed as a network of ES systems across the project are and operated by the System of Systems.
Additional Reading
Fisher, Rebecca E., James L. France, David Lowry, Mathias Lanoisellé, Rebecca Brownlow, John A. Pyle, Michelle Cain et al. “Measurement of the 13C isotopic signature of methane emissions from northern European wetlands.” Global Biogeochemical Cycles 31, no. 3 (2017): 605-623.
Oikawa, P. Y., C. Sturtevant, S. H. Knox, J. Verfaillie, Y. W. Huang, and D. D. Baldocchi. “Revisiting the partitioning of net ecosystem exchange of CO 2 into photosynthesis and respiration with simultaneous flux measurements of 13 CO 2 and CO 2, soil respiration and a biophysical model, CANVEG.” Agricultural and Forest Meteorology 234 (2017): 149-163.
Wichura, Bodo, Johannes Ruppert, Michael Riederer, and Thomas Foken. “Isotope Fluxes.” In Energy and Matter Fluxes of a Spruce Forest Ecosystem, pp. 209-245. Springer International Publishing, 2017.
Baldocchi, Dennis. “Measuring fluxes of trace gases and energy between ecosystems and the atmosphere–the state and future of the eddy covariance method.” Global change biology 20, no. 12 (2014): 3600-3609.
Wehr, R., J. W. Munger, D. D. Nelson, J. B. McManus, M. S. Zahniser, S. C. Wofsy, and S. R. Saleska. “Long-term eddy covariance measurements of the isotopic composition of the ecosystem–atmosphere exchange of CO 2 in a temperate forest.” Agricultural and forest meteorology 181 (2013): 69-84.
 Soil Accumulation Chambers (SAC)
Soils act as source and sink for CO2, CH4, and N2O and require precise quantification to obtain reliable project budgets. Soils typically contain 2 to 3 times the amount of carbon compared to the overlying biomass and is typically heterogeneous across the landscape posing challenges to determine average values for a given landscape or project area. In the context of Pα projects, soil accumulation chambers would be deployed at fixed locations and across selected sites for a mobile system. The efflux of CO2 isotopologues could also be measured and directly linked to below ground carbon as described previously. Eddy covariance can also be employed to determine soil CO2 efflux [112]. Soil accumulation chambers can be operated manually or by automated systems.
Additional Reading
Delle Vedove, Gemini, Giorgio Alberti, Michel Zuliani, and Alessandro Peressotti. “Automated monitoring of soil respiration: an improved automatic chamber system.” Italian Journal of Agronomy 2, no. 4 (2007): 377-382.
Dinsmore, Kerry J., Julia Drewer, Peter E. Levy, Charles George, Annalea Lohila, Mika Aurela, and Ute M. Skiba. “Growing season CH 4 and N 2 O fluxes from a subarctic landscape in northern Finland; from chamber to landscape scale.” Biogeosciences 14, no. 4 (2017): 799.
Jassal, Rachhpal S., T. Andrew Black, Zoran Nesic, and David Gaumont-Guay. “Using automated non-steady-state chamber systems for making continuous long-term measurements of soil CO 2 efflux in forest ecosystems.” Agricultural and Forest Meteorology 161 (2012): 57-65.
Scott, Albert, Ian Crichton, and Bruce C. Ball. “Long-term monitoring of soil gas fluxes with closed chambers using automated and manual systems.” Journal of Environmental Quality 28, no. 5 (1999): 1637-1643.
 Soil gas probes (SGP)
Soil gas probes are hollow metal tubes (e.g., 1/4″ diameter) with perforations to allow gas transfer from the soil atmosphere, at desired depths, to the tube available for sampling above ground. The main purpose of the soil gas probe is to directly sample the soil atmosphere to determine and verify the CO2 and other gas concentrations and isotopic signatures of the soil gas at a given depth or feature of the project landscape. Soil gas probes are fixed in place at various depths across the project landscape and sampled at scheduled intervals by allowing gas to flow into field analyzers or capturing the gas in a sample flask for subsequent analysis.
Additional Reading
Chen, Fu, Wangyuan Zhang, Jing Ma, Yongjun Yang, Shaoliang Zhang, and Run Chen. “Experimental study on the effects of underground CO 2 leakage on soil microbial consortia.” International Journal of Greenhouse Gas Control 63 (2017): 241-248.
Laemmel, T., M. Maier, H. Schack‐Kirchner, and F. Lang. “An in situ method for real‐time measurement of gas transport in soil.” European Journal of Soil Science 68, no. 2 (2017): 156-166.
Watkins, Cody S. “Hydrocarbon and CO 2 emissions from oil and gas production well pad soils comparative to background soil emissions in eastern Utah.” PhD diss., Utah State University, 2017.
Biose, E., G. U. Nnaji, C. F. Amaechi, N. O. Erhunmwunse, and A. F. Eghomwanre. “Effects of Below Ground Controlled Injections of CO2 on Microbial Respiration of Soil Planted With Wheat (Triticum aestivum L.).” African Scientist 17, no. 2 (2016).
 Exsolvation of Dissolved CO2 (CO2(aqueous)) and CH4
Project areas with large water features such as lakes, marshes and rivers may represent significant fractions of the total CO2 budget. The rate of efflux and isotopic composition of the CO2 released or taken up can be determined by exsolvation, or exsolution, the dissolved gases from aqueous samples (e.g., CO2 aqueous, and CH4) followed by measurements employing integrated field analyzers. Mobile EC stations may also be placed near or within water features to obtain GHG fluxes as described previously to augment exsolvation sample data.
Additional Reading
Hartmann, Jan F., Amanda Schiller, Torben Gentz, Markus Greule, Hans-Peter Grossart, Danny Ionescu, Frank Keppler, Karla Martinez-Cruz, Armando Sepulveda-Jauregui, and Margot Isenbeck-Schröter. “Real Time Measurement of Concentration and δ 13 C-CH 4 in Water.” Procedia Earth and Planetary Science 17 (2017): 460-463.
Sorribas, Mino Viana, David Motta Marques, Nilza Maria dos Reis Castro, and Fernando Mainardi Fan. “Fluvial carbon export and CO2 efflux in representative nested headwater catchments of the eastern La Plata River Basin.” Hydrological Processes 31, no. 5 (2017): 995-1006.
Gonzalez-Valencia, Rodrigo, Felipe Magana-Rodriguez, Oscar Gerardo-Nieto, Armando Sepulveda-Jauregui, Karla Martinez-Cruz, Katey Walter Anthony, Doug Baer, and Frederic Thalasso. “In situ measurement of dissolved methane and carbon dioxide in freshwater ecosystems by off-axis integrated cavity output spectroscopy.” Environmental science & technology 48, no. 19 (2014): 11421-11428.
 Vehicle Mounted Fast Response Gas Analyzers (VM)
In some cases it may be advantageous to sample and analyze the atmosphere while moving along a course or a road using an electric vehicle. The gas inlet is attached to a mast extending vertically from the vehicle leading to a fast response analyzer to accommodate high precision analysis of gases. The vehicle mounted analyzer is of particular advantage when measuring for CH4 gas released from wetlands, lakes and rivers in the project area.
Additional Reading
Lee, Joseph K., Andreas Christen, Rick Ketler, and Zoran Nesic. “A mobile sensor network to map carbon dioxide emissions in urban environments.” Atmospheric Measurement Techniques 10, no. 2 (2017): 645.
Tsai, Tracy R., Kendrick Du, and Bill Stavropoulos. “New system for detecting, mapping, monitoring, quantifying and reporting fugitive gas emissions.” The APPEA Journal 57, no. 2 (2017): 561-566.
 Unmanned Aerial Systems (UAS) and Remote Sensing (RS)
 A variety of UAS’s may be used in a project to record the status of forest conditions at low altitude (e.g., ~1,000 ft) on a routine basis, when a disturbance has occurred (e.g., hurricane, drought, timber operations) or for surveillance of forest activity by landowners or others accessing the site. Typical capabilities may include spectral imaging of the tree canopy and mapping functions to reveal differences along the flight path over time. In addition, UAS’s may also carry miniaturized gas sensors for CO2, CH4 and other atmospheric gases. The use of remote sensing (RS) for ecological research is well documented covering spectral bands for normalized difference vegetation index (NDVI), leaf evapotranspiration and other features of the biotic and abiotic project area.
Additional Reading:
Galidaki, Georgia, Dimitris Zianis, Ioannis Gitas, Kalliopi Radoglou, Vassilia Karathanassi, Maria Tsakiri–Strati, Iain Woodhouse, and Giorgos Mallinis. “Vegetation biomass estimation with remote sensing: focus on forest and other wooded land over the Mediterranean ecosystem.” International Journal of Remote Sensing 38, no. 7 (2017): 1940-1966.
Goodbody, Tristan RH, Nicholas C. Coops, Peter L. Marshall, Piotr Tompalski, and Patrick Crawford. “Unmanned aerial systems for precision forest inventory purposes: A review and case study.” The Forestry Chronicle 93, no. 1 (2017): 71-81.
Grinand, Clovis, Guerric Le Maire, Ghislain Vieilledent, H. Razakamanarivo, Tiana Razafimbelo, and Martial Bernoux. “Estimating temporal changes in soil carbon stocks at ecoregional scale in Madagascar using remote-sensing.” International Journal of Applied Earth Observation and Geoinformation 54 (2017): 1-14.
Howell, Travis Lynn. “The Benefits and Applications of Unmanned Aerial Systems (UAS) to Natural Resources & Forest Management.” (2017).
Sanchez‐Azofeifa, Arturo, Jose Antonio Guzmán, Carlos A. Campos, Saulo Castro, Virginia Garcia‐Millan, Joanne Nightingale, and Cassidy Rankine. “Twenty‐first century remote sensing technologies are revolutionizing the study of tropical forests.” Biotropica (2017).
Sankey, Temuulen, Jonathon Donager, Jason McVay, and Joel B. Sankey. “UAV lidar and hyperspectral fusion for forest monitoring in the southwestern USA.” Remote Sensing of Environment 195 (2017): 30-43.
 Flask Collection (FC)
Gas and liquid samples can be collected in specially designed flasks for analysis in the field or at a remote laboratory. Flask collection of samples will augment results for field analysis as checks on field data and for analysis of sample composition not attainable in the field. Flask collection of air for radiocarbon analysis will be undertaken at selected sites employing automated air sampling systems.
Additional Reading:
Miller, John, Scott Lehman, Chad Wolak, Jocelyn Turnbull, Gregory Dunn, Heather Graven, Ralph Keeling et al. “Initial results of an intercomparison of AMS-based atmospheric 14 CO 2 measurements.” Radiocarbon 55, no. 3 (2013): 1475-1483.
Komhyr, W. D., R. H. Gammon, T. B. Harris, L. S. Waterman, T. J. Conway, W. R. Taylor, and K. W. Thoning. “Global atmospheric CO2 distribution and variations from 1968–1982 NOAA/GMCC CO2 flask sample data.” Journal of Geophysical Research: Atmospheres 90, no. D3 (1985): 5567-5596.
The Air Sampling & Monitoring: Hermes 80 V.4A Precision Flask Package (PFP)
 Nitrous Oxide (N2O)
Nitrous oxide is ~ 298 times more potent as a greenhouse gas (GHG) relative to CO2. N2O has no significant sinks on land and is destroyed by chemical reactions in the upper atmosphere. Land surfaces are the main source of atmospheric N2O indicating that changes in land-use practices can modify soil emissions and influence N2O concentration in the atmosphere. The uncertainty of sources and sinks of N2O and its atmospheric lifetime limit an accurate budget. Existing data on fluxes of N2O from soils and oceans are insufficient to quantify them in detail. About half of the global N2O emissions are anthropogenic resulting from microbiological processes in soils related to agriculture and tropical forests. The importance of quantification for N2O across PαC projects in combination with CO2 and CH4 is a high priority and should add to diverse ecosystem level data for this important GHG of the tropics.

Additional Reading:
IPCC Working Group I: The Scientific Basis
https://www.ipcc.ch/ipccreports/tar/wg1/136.htm
Arias‐Navarro, Cristina, Eugenio Díaz‐Pinés, Steffen Klatt, Patric Brandt, Mariana C. Rufino, Klaus Butterbach‐Bahl, and L. V. Verchot. “Spatial variability of soil N2O and CO2 fluxes in different topographic positions in a tropical montane forest in Kenya.” Journal of Geophysical Research: Biogeosciences 122, no. 3 (2017): 514-527.
Lognoul, Margaux, Alain Debacq, Bernard Heinesch, and Marc Aubinet. “N2O eddy covariance fluxes: from field measurements to flux analysis.” (2017).
Olin, Stefan, Xu-Ri Xing, David Wårlind, Peter Eliasson, Ben Smith, and Almut Arneth. “Global terrestrial N2O budget for present and future.” In EGU General Assembly Conference Abstracts, vol. 19, p. 17872. 2017.
Upstill-Goddard, Robert C., Matthew E. Salter, Paul J. Mann, Jonathan Barnes, John Poulsen, Bienvenu Dinga, Gregory J. Fiske, and Robert M. Holmes. “The riverine source of CH 4 and N 2 O from the Republic of Congo, western Congo Basin.” Biogeosciences 14, no. 9 (2017): 2267.
Dlugokencky, E. J., A. M. Crotwell, M. Crotwell, K. A. Masarie, P. M. Lang, G. S. Dutton, and B. D. Hall. “NOAA’s Global Network of N2O Observations.” In AGU Fall Meeting Abstracts. 2014.
 Sulfur Hexaflouride (SF6)
Emissions of sulfur hexaflouride, SF6 are virtually all of anthropogenic origin, and as such, were not part of the pre-industrial atmosphere. Estimation of global historical emissions of SF6 reveal that the primary sources originate from the electricity sector (e.g., gas insulated-switchgear, circuit breakers), the magnesium industry (primary production and die casting), the electronics industry (e.g., SF6 is used in semiconductor (chip waver) manufacturing processes), and in adiabatic property applications (e.g., tennis balls, shoe soles and truck tires). As a greenhouse gas, SF6 is ~ 23,500 times more potent relative to CO2 as warming agent. Pα will deploy SF6 analyzers on the Global Monitor Platform (GMP) for selected projects depending on feasibility of field deployment. As the demand for electricity grows as a result of population growth and growth of urban centers we can expect SF6 emissions to also increase emphasizing the importance of quantifying and limiting release of this potent GHG.

Additional Reading:
Ray, Eric A., Fred L. Moore, James W. Elkins, Karen H. Rosenlof, Johannes C. Laube, Thomas Röckmann, Daniel R. Marsh, and Arlyn E. Andrews. “Quantification of the SF6 lifetime based on mesospheric loss measured in the stratospheric polar vortex.” Journal of Geophysical Research: Atmospheres 122, no. 8 (2017): 4626-4638.
Geller, L. S., J. W. Elkins, J. M. Lobert, A. D. Clarke, D. F. Hurst, J. H. Butler, and R. C. Myers. “Tropospheric SF6: Observed latitudinal distribution and trends, derived emissions and interhemispheric exchange time.” Geophysical Research Letters 24, no. 6 (1997): 675-678.
Dullni, Edgar, Thor Endre, Yannick Kieffel, and Renzo Coccioni. “Reducing SF6 emissions from electrical switchgear.” Carbon Management 6, no. 3-4 (2015): 77-87.
 Tree Plantation
 Perfluorocarbon (PFC)