 revised")
PaC Monitors the Planet to Manage Climate Change and Conserve Forests

DATA SOURCE: NOAA. CarbonTracker CO2 weather for June-July, 2008. Warm colors show high atmospheric CO2 concentrations, and cool colors show low concentrations. As the summer growing season takes hold, photosynthesis by forests and crops draws concentrations of CO2 down, opposing the general increase from fossil fuel burning. The resulting high- and low-CO2 air masses are then moved around by weather systems to form the patterns shown here. Extracted from https://www.esrl.noaa.gov/gmd/ccgg/carbontracker/

DATA SOURCE: NOAA. CarbonTracker CH4 column average CH4 for July-August, 2007. Warm colors show high atmospheric CH4 concentrations, and cool colors show low concentrations. This sequence shows relatively large emissions from wetlands in Western Siberia and emissions from anthropogenic and natural sources in India and Asia. The resulting high CH4 air masses are then moved by weather systems to form the patterns shown in this animation. Extracted from https://www.esrl.noaa.gov/gmd/ccgg/carbontracker-ch4/
PaC US National Carbon Portfolio
Based on NEON and Ameriflux Networks: Eddy Covariance Results
PaC provides provisional summaries of carbon flux for the US, based on the direct measurement of CO2 by eddy covariance within the forest and related terrestrial project areas reported for NEON and Ameriflux sites. While these data are representative of the characteristic footprint for each site, and may not fully represent surrounding regions, PaC is employing this data as a first step in creating a verifiable direct measurement program for a US National carbon trading system.
Note: the data employed in PaC carbon portfolios are for illustration purposes only and are not in any way officially endorsed by the NEON or Ameriflux organizations. All terms and conditions for data reporting, data quality control, and download instructions can be found on the respective webpages cited below.
National Ecological Observatory Network
Continental-Scale Ecosystem Observation System
NEON provides the only freely accessible and integrated network of CO2 dynamics for the Continental US. 47 NEON sites are distributed across the US partitioned into 20 ecoregions. Learn more about NEON here: NEON.
The Ameriflux Network
Scientific Community Based Ecosystem Monitoring
The AmeriFlux network is a community of sites and scientists measuring ecosystem carbon, water, and energy fluxes across the Americas, and committed to producing and sharing high-quality eddy covariance data. AmeriFlux investigators and modelers work together to generate an understanding of terrestrial ecosystems in a changing world. Learn more about Ameriflux here: Ameriflux.
US National Carbon Portfolio
Net Ecosystem Exchange & Ecosystem Respiration
The charts below represent current NEON and Ameriflux data for Net Ecosystem Exchange (NEE) and corresponding ecosystem respiration (Reco). NEE shows the total metric tons of CO2 (tCO2equivalent) sequestered as net forest carbon (NEE). The ecosystem respiration is also represented as tCO2equivalent.
Planet Alpha Portfolio Builder
The portfolio builder provides users of the Gaia Monitor to study the US landscape through the lens of CO2 flux. Eddy covariance provides data for NEE, here defined as net forest carbon sequestration, which is partitioned into the components of Ecosystem Respiration (Reco) and Gross Primary Production (GPP) according to Eq.1 using models that predict the rates of Reco during daylight hours from nighttime observations when GPP is zero according to the following relationship:
NEE = GPP + Reco (1).
Single sites or diverse portfolios of sites can be combined and analyzed with the portfolio builder. To use the portfolio builder, please login here.
An interactive map of the sites available through the portfolio builder is provided at the bottom of this page. Note that data are provided on a square meter area basis. The actual footprint area for each eddy covariance site is not reported. Extrapolation to larger areas or upscaling of a single site beyond the site footprint requires additional observations including remotely sensed data and appropriate models for the region.
Research towers map. It contains all the sites from FluxNet and NEON databases that have at least one year with > 80% of NEE data. FluxNet dataset can be found in https://fluxnet.org/, while NEON data can be downloaded from AmeriFlux network (https://ameriflux.lbl.gov/). The left panel allows adding/remove different layers useful to understand NEE dynamics. PEM fully acknowledges these institutions and the stewardship and terms of usage of all data products. PEM thanks all researchers who have worked tirelessly to set up, maintain and report all flux data that are represented by the sites on this map and as sites employed by the Gaia Monitor Portfolio Builder.
How to Use the Gaia Monitor Portfolio Builder
Select the Site View or Portfolio View option. Then select the site or sites of interest. Select two pricing options and two area options. Then select SUBMIT. Results representing a single site or results for a combined portfolio will be displayed including values for NEE, Reco, and GPP. Monthly values for NEE and pricing values are provided for the available time series. Compare and contrast portfolios from different regions and within regions.


 Biodiversity (B) Avoided Carbon
 Gorilla Habitat (G) Avoided Carbon
 Methane (CH4)
 Indigenous Peoples (IP) Avoided Carbon
 Improved Forestry Management (IFM) Sequestration
 Afforestation (AF) Sequestration
 Agroforestry (GF) Sequestration
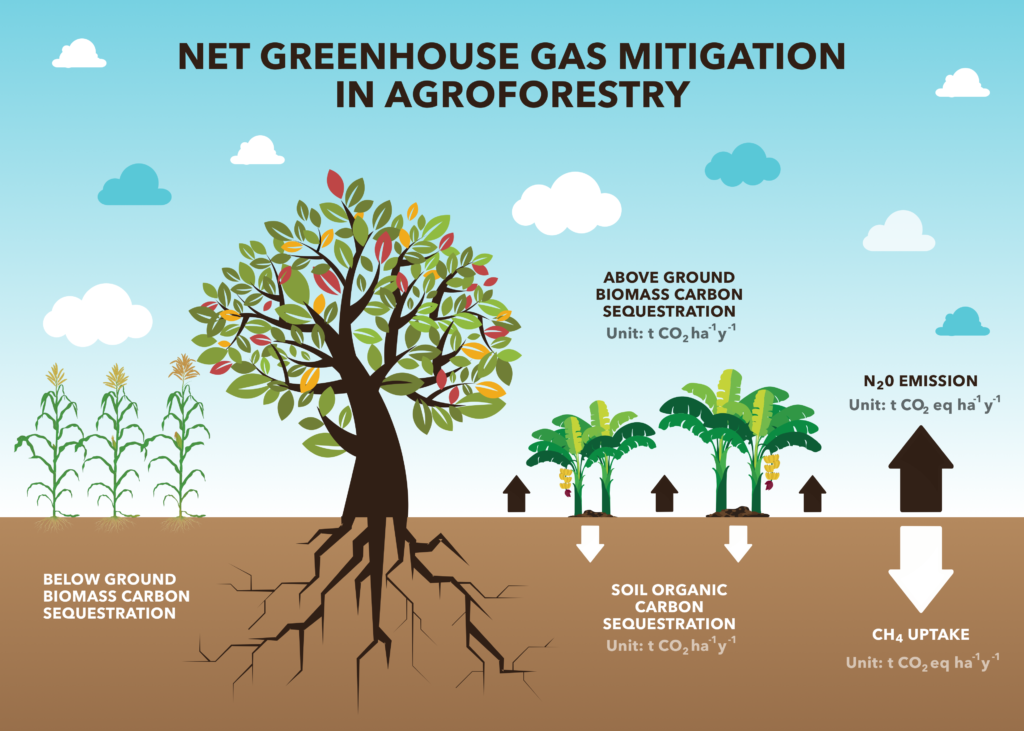

 The System of Systems (SoS)
 QuantumQarbon
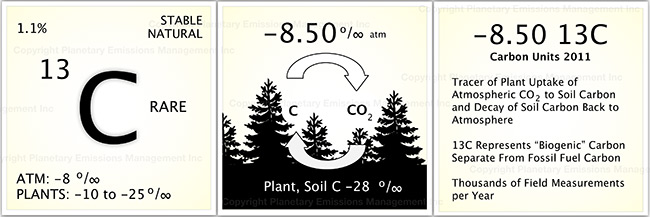
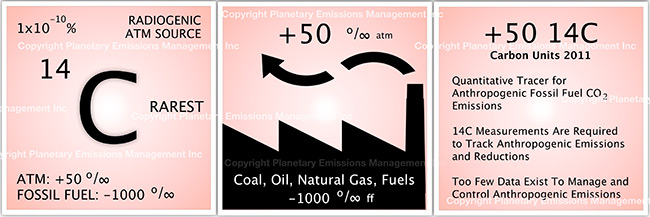
 Carbon isotopic analysis (IA)

 Carbon Dioxide (CO2)
 Working Forest Carbon Sequestration
 Eddy Covariance (EC)
 Soil Accumulation Chambers (SAC)
 Soil gas probes (SGP)
 Exsolvation of Dissolved CO2 (CO2(aqueous)) and CH4
 Vehicle Mounted Fast Response Gas Analyzers (VM)
 Unmanned Aerial Systems (UAS) and Remote Sensing (RS)
 A variety of UAS’s may be used in a project to record the status of forest conditions at low altitude (e.g., ~1,000 ft) on a routine basis, when a disturbance has occurred (e.g., hurricane, drought, timber operations) or for surveillance of forest activity by landowners or others accessing the site. Typical capabilities may include spectral imaging of the tree canopy and mapping functions to reveal differences along the flight path over time. In addition, UAS’s may also carry miniaturized gas sensors for CO2, CH4 and other atmospheric gases. The use of remote sensing (RS) for ecological research is well documented covering spectral bands for normalized difference vegetation index (NDVI), leaf evapotranspiration and other features of the biotic and abiotic project area.
 Flask Collection (FC)
 Nitrous Oxide (N2O)
 Sulfur Hexaflouride (SF6)
 Tree Plantation
 Perfluorocarbon (PFC)
 Water Vapor (H2O)